Website-Designing
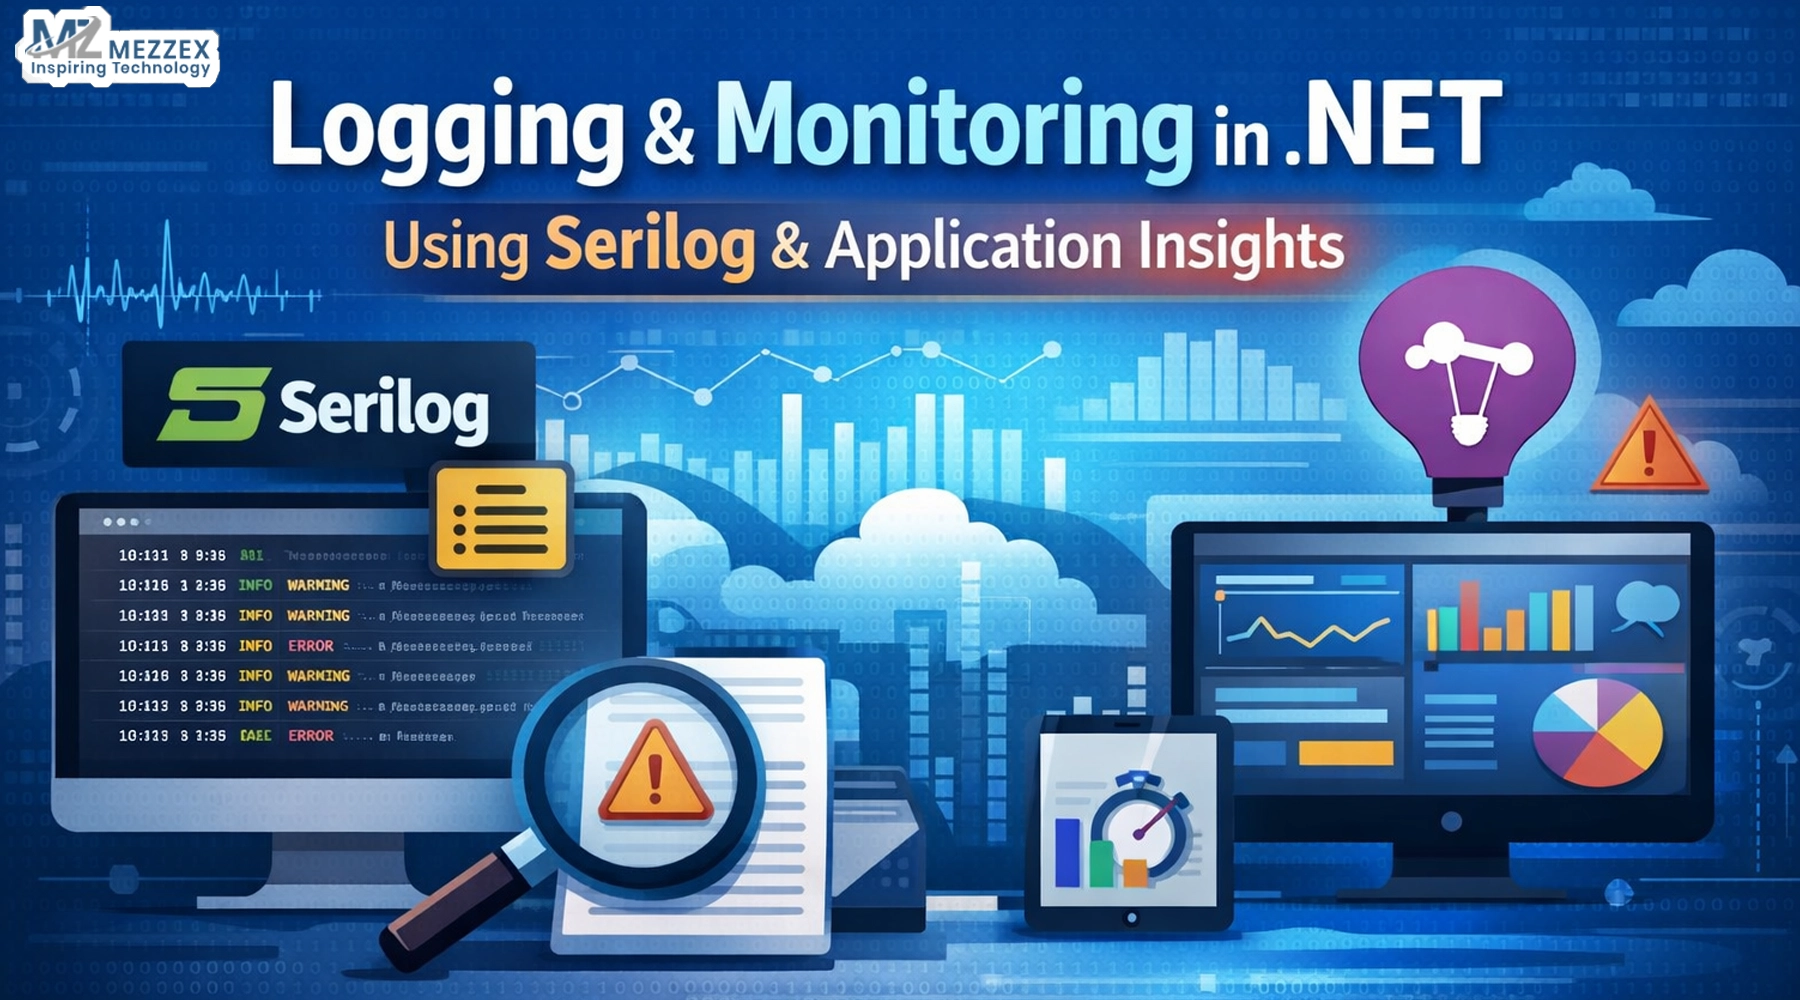
Logging and Monitoring in .NET Using Serilog and Application Insights
A release goes live. The dashboard looks calm. Then a user report lands: checkout fails “sometimes.” The team opens logs and finds noise, missing context, and no clean path from request to exception. Time slips. Trust slips. This pattern repeats when logging stays unstructured, and monitoring stays disconnected from code. A better setup keeps every event searchable and ties every trace back to one operation. Serilog gives structure to what the app says. Application Insights shows what the app does under load and where it breaks. This guide explains what to log, how to wire it up, and how to use it in production.
Logging vs monitoring in .NET
- Logging answers “what the code decides and why,” so each event records a decision, a failure, or a business step (for example, “payment starts,” “inventory reserve fails,” “order confirms”).
- Monitoring answers “what the system experiences,” so it tracks requests, dependency calls, exceptions, and timings across real traffic.
-
- Treat both as one workflow: logs explain intent and domain context, while telemetry shows impact and scope during an incident.
-
- Use one mental test during the “checkout sometimes fails” incident: logs tell the story inside the checkout code, while telemetry shows which endpoint slows down and which dependency fails.
- Set one outcome goal before tooling: reduce time to isolate the failing step (auth, pricing, payment, email, or database) from hours to minutes.
Set up Serilog structured logging
- Use Serilog because it writes fully structured events (properties + message template) instead of only text, which makes filtering and aggregation reliable.
-
- Log with stable message templates and push data into named properties (for example,
OrderId,CartId,PaymentProvider,TenantId) so queries do not depend on phrasing. - Add correlation early in the request and keep it consistent:
- Put a
CorrelationIdintoLogContextat the start of the request pipeline. - Add
OrderIdOnly after the system creates it, so logs stay accurate and traceable. - Keep log levels strict in production:
- Use Information for key business milestones, not every internal step.
- Use a Warning for recoverable problems (retry, fallback, slow dependency) that still need attention.
- Use Error for failures that block checkout, charge, or confirmation.
- Apply a clear sink strategy per environment:
- Use the console for local and container diagnostics.
- Use Application Insights as a central sink when the team already uses Azure Monitor for production visibility.
-
- Example logging pattern (keeps structure and avoids noise):
Log.Information("Checkout started for {CartId} with {ItemCount} items", cartId, itemCount);Log.Warning("Payment timeout for {OrderId} via {PaymentProvider}", orderId, provider);Log.Error(ex, "Checkout failed for {OrderId} at step {Step}", orderId, step);
Add Application Insights monitoring
- Use Application Insights to collect request telemetry, dependency telemetry, and exception telemetry so you see failures even when logs miss details.
-
- Rely on telemetry correlation so one operation groups the request, the database calls, the external API calls, and the exceptions under the same trace.
- Track the checkout path as an operation:
- Watch request duration and response codes for
/checkout,/payment, and/order/confirm. - Watch dependency duration and failure rate for SQL, Redis, payment gateways, and email providers.
-
- Add custom dimensions for domain context (without sensitive data):
- Add
TenantId,Region,PaymentProvider, andFeatureFlagto help the team isolate “sometimes” into a real segment. - Avoid storing tokens, passwords, full card numbers, or secrets in telemetry.
- Use alerts that match user impact:
- Alert on error-rate spikes for checkout endpoints.
- Alert on dependency failures and latency jumps that often cause “works on retry” behaviour.
Connect logs and telemetry end-to-end
- Send Serilog events into Application Insights through a supported sink so the team can query structured logs alongside request and dependency telemetry.
-
- Keep correlation consistent across logs and telemetry:
- Use
LogContextto attachCorrelationIdto every log during a request. - Let Application Insights use distributed tracing correlation so the same operation links services and dependencies.
- Design the “incident view” you want before you tune the config:
- Start from a failed request in Application Insights.
- Jump to the connected trace and find the specific Serilog events that name the failing step and the
OrderId. -
- Check the common failure mode early: the team sees request telemetry but cannot find logs because filtering drops Information traces, or the sink converter routes events unexpectedly.
-
- Validate shutdown behaviour for background jobs and short-lived workers, so they flush telemetry before exit and do not drop the last error.
What to log, query, and improve
- Log events that shorten triage for “checkout sometimes fails”:
- “Checkout started” with
CartId,TenantId, andCorrelationIdso you anchor the story. - “Payment request sent” with
PaymentProvider,Amount, andOrderIdso you pinpoint the boundary. - “Payment response received” with status and duration, so you can prove where time goes.
- Avoid patterns that create cost and confusion:
- Avoid “log everything” at Information because it buries checkout failures under framework chatter.
- Avoid unstructured dumps of objects because queries fail and PII leaks become more likely.
-
- Use practical queries that match how engineers debug:
- Filter failed checkout requests, then group by
PaymentProviderto catch a vendor-specific issue. - Find slow dependency calls and sort by duration to see if timeouts align with the failure window.
-
- Pivot by
TenantIdorRegionso “sometimes” becomes “only in region X” or “only for tenant Y.” - Turn findings into changes the system keeps:
- Add one new structured property when the team asks the same question twice during incidents (for example,
CheckoutStep). - Reduce noise by lowering Microsoft log levels and raising only the categories that support production triage.
- Review dashboards weekly and delete metrics that never drive action, then replace them with one chart that answers a real support question.
Get In Touch
Build a logging and monitoring setup that helps your team fix incidents faster and with less guesswork. Use structured logging with Serilog and connect it to Application Insights so you trace each checkout request across logs, dependencies, and exceptions in one view. If you want a clear plan for your .NET app, book an observability review with Mezzex and map the right log events, correlation approach, and alert rules for your release workflow. Explore services: Contact Mezzex.
